Mathematics & Finance • University of Alberta

Jakob Bickley

Finance, insurance, and data operations with a strong analytical foundation.

I focus on practical work that improves reporting, streamlines workflows, and turns messy processes into cleaner systems. My experience spans underwriting support, Excel and Python automation, academic leadership, and quantitative finance.

Currently working as a Junior Financial Analyst at Franvest Capital Partners, with continued interest in finance, analytics, and workflow-focused projects.

Education BSc Mathematics & Finance May 2026
Academic Standing 3.9 GPA University of Alberta
Designation Passed CFA Level I May 2026
Focus Automation + Analytics Excel, Python, Finance

Background

Education & experience

A cleaner snapshot of academics, scholarships, and roles that shaped how I work.

Passed CFA Level I (May 2026)

University of Alberta - BSc in Mathematics & Finance (May 2026)

  • GPA: 3.9
  • Scholarships:
    • The Cathy Allard-Roozen Leadership Award (2023)
    • Louise McKinney Scholarship (2023)
    • Thorleif M. Fostvedt Scholarship in Mathematics (2024)
    • The I M May Denham Memorial Scholarship in Mathematics (2025)
Feb 2026 - Present

Franvest Capital Partners - Junior Financial Analyst

  • Analyzed operating company data to evaluate consumer behaviour, market trends, revenue performance, and operating KPIs for strategic and investment decision-making.
  • Performed financial analysis and modelling across direct operating companies, private equity fund investments, real estate investments, and public market portfolios.
  • Prepared public market reporting, including portfolio performance summaries, market commentary, and investment analysis for internal stakeholders.
  • Built Power BI dashboards and promoted AI adoption by identifying automation opportunities, supporting training, and integrating AI tools into reporting workflows.
May 2025 - Sept 2025

Saskatchewan Government Insurance - Summer Underwriting Intern

  • Supported commercial property and auto underwriting teams and worked with brokers to improve quote accuracy and turnaround time.
  • Built automated Excel tools to track premiums, quoting success, and broker KPIs, reducing manual reporting time by about 40%.
  • Used Python, Selenium, and approved AI tools to streamline administrative workflows and reduce repetitive intake work.
  • Standardized intake checklists and quality controls to reduce rework and improve submission completeness.
  • Documented repeatable procedures and helped triage edge cases across teams.
Sep 2024 - May 2025, Sept 2025 - Present

University of Alberta - Teaching Assistant (Calculus)

  • Evaluated 1,200+ assignments weekly using consistent rubrics and quantitative grading checks.
  • Led problem-solving support and identified recurring learning gaps to improve outcomes.
  • Provided structured feedback to instructors on common errors and opportunities for clarification.
Aug 2023 - May 2025

University of Alberta - Residence Assistant

  • Supported and mentored 45+ residents and was recognized as RA of the Year (2024-2025).
  • Planned and ran monthly programming that increased engagement and academic support.
  • Managed incidents, mediated conflicts, and coordinated with campus teams while maintaining clear documentation.
  • Promoted inclusion, wellbeing, and accountability through proactive communication.

Capabilities

Technical skills

A concise view of the tools and finance skills I rely on most.

Python & R

Data analysis, automation, and statistical modelling

Pandas NumPy Matplotlib Selenium R (regression) ggplot2 PDF/Email parsing Regex

Excel & VBA

Financial models and operational tools for end users

Advanced formulas Power Query PivotTables VBA automation Scenario analysis Dashboard creation

Tools & platforms

Reporting, visualization, and productivity environments

Power BI Bloomberg Terminal SQL Google Workspace LaTeX AI productivity tools

AI & LLMs

Building pipelines, RAG systems, and automated workflows with large language models

RAG systems LLM pipelines Local models Claude API Claude Code Prompt engineering Document automation Analytics automation

Finance & risk

Investment analysis, insurance, and quantitative finance

Financial modelling Valuation Financial statement analysis Portfolio analysis Public market reporting Corporate finance Risk analysis Stress testing Underwriting analytics Derivatives pricing Fixed income DCF modelling

Selected work

Projects

Energy analytics, quantitative finance, and workflow automation.

Featured project

Electricity Capacity & Risk Analysis

Alberta grid mix shift, renewables growth, and large-load connection risk modelled with AESO data

R ggplot2 AESO Data Energy Risk
Focus Grid mix shift
Data source AESO capacity + queue
Key finding Data-centre demand
Tools R + ggplot2
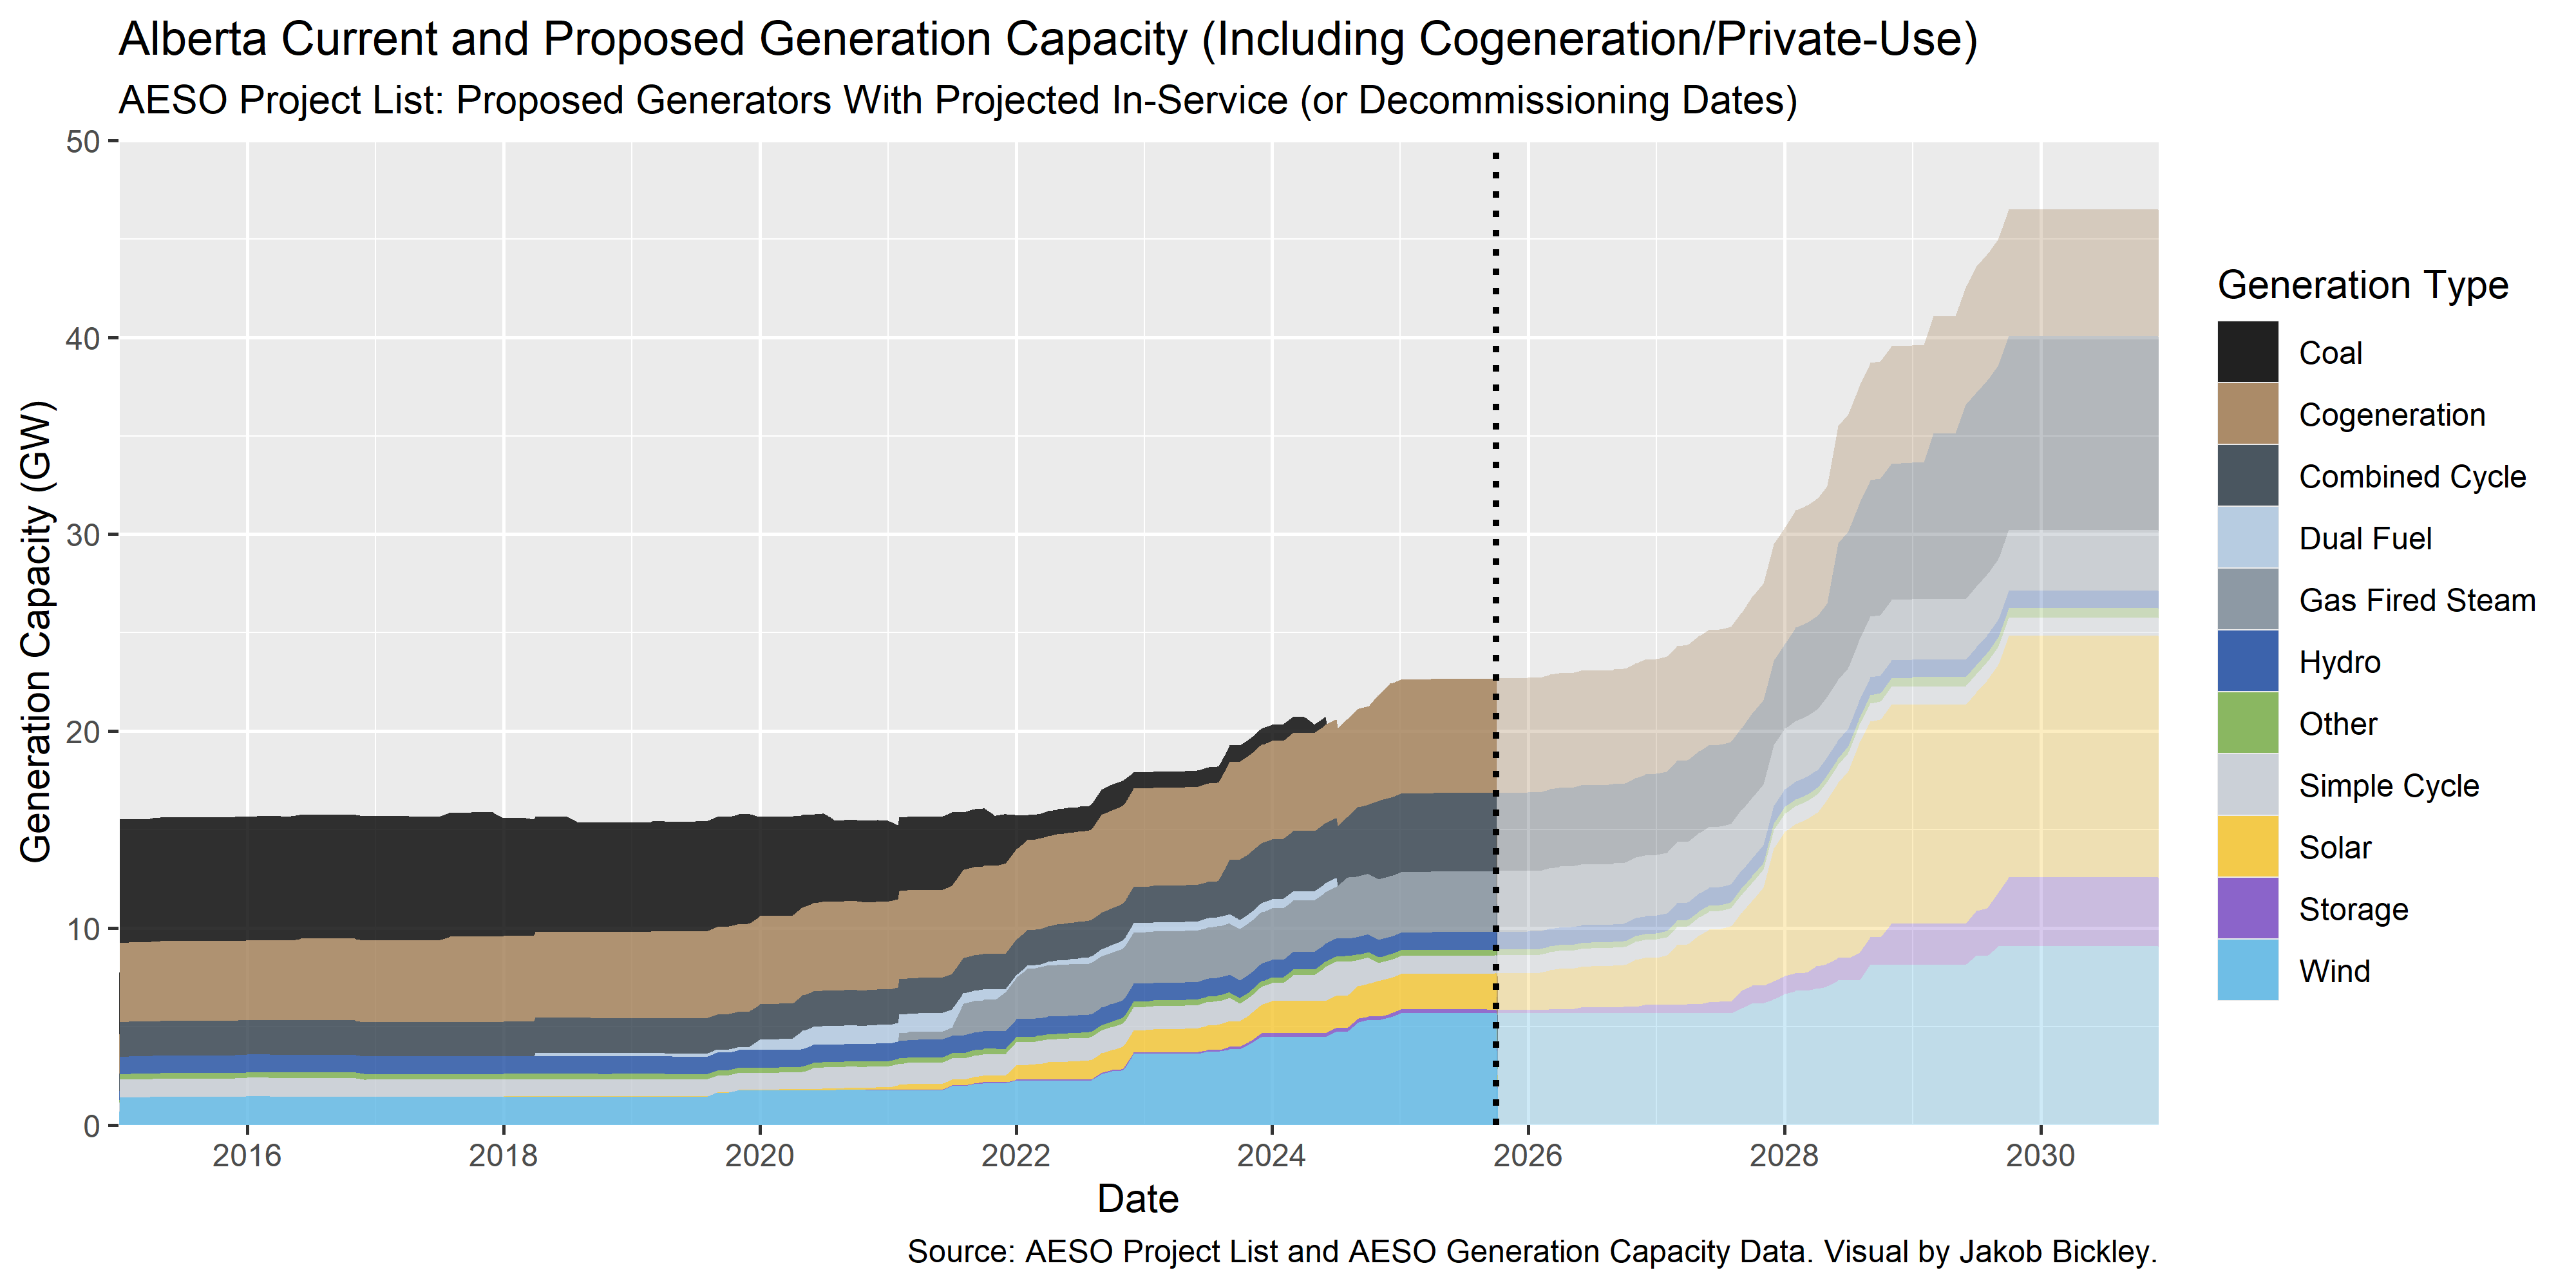
Alberta current and proposed generation capacity by fuel type

This project examines how Alberta's generation mix has changed following the coal phase-out, with a focus on the rapid growth of wind, solar, and battery storage. Using AESO capacity and connection-queue data, it tracks how the grid's fuel composition has shifted and models what the pipeline of proposed connections means for supply adequacy and price risk going forward.

A central finding is the scale of proposed new load, including substantial data-centre demand driven by AI infrastructure expansion, relative to what the system can realistically absorb in the near term. The analysis frames this as a risk management question: grid operators and long-term energy buyers face real uncertainty around curtailment, pricing volatility, and firm supply adequacy as intermittent capacity grows faster than dispatchable alternatives.

  • Tracked decade-long capacity trends by fuel type using AESO historical data and ggplot2 visualizations.
  • Analyzed the connection-project queue to estimate near-term supply additions and their intermittency profile.
  • Identified proposed data-centre load as a structural inflection point for Alberta grid planning and rate exposure.

Quantitative research

A Markov Model of Bank Runs under Interest Rate Shocks

Monte Carlo stress-test of SVB's balance sheet using stochastic rates and sentiment-driven deposit flows

Python NumPy Monte Carlo Stochastic Processes
Simulations n = 100,000
Mean failure time 138 days
Mean loss (failures) $0.38B
Calibrated to Silicon Valley Bank

Collaborative academic research project.

We built a Markov model to represent how bank withdrawals and asset liquidations evolve under changing interest rates and depositor sentiment. The model combines three components: a jump-augmented Vasicek process for interest rates (capturing both gradual drift and sudden rate shocks), Poisson processes for deposit inflows and outflows whose intensities shift with both the rate environment and prevailing confidence, and a three-state sentiment chain (Calm, Stressed, Panic) governing how quickly funding stress can escalate into a run.

We framed the problem as the risk management team at Silicon Valley Bank just before its 2023 collapse, calibrating the model's balance sheet parameters to SVB's actual structure. Across 100,000 Monte Carlo runs, the model estimated a mean loss of $0.38B for failed scenarios against SVB's true ~$1B realized loss, well within one standard deviation. The simulation makes clear how small sentiment shocks compound through fire-sale dynamics, and how a highly rate-sensitive depositor base is the primary driver of failure probability.

  • Interest rates modeled via jump-augmented Vasicek SDE; simulated using a modified birth-death process (N = 10,000) interpolated to a 366-day daily grid.
  • Confidence-state transitions (Calm → Stressed → Panic) driven by large withdrawal events and fire-sale signals; three asset classes: cash-like, short-term, and long-term.
  • Failure time median 118 days (mean 138); mean conditional loss $0.38B, unconditional average $0.37B across all runs.
Read the full report →

Workflow automation

Excel-Driven Guidewire Automation

Bulk vehicle and coverage configuration via Python + Selenium, keeping Excel as the user interface

Excel Python Selenium Insurance Ops

Built during the SGI underwriting internship. Users enter VINs or vehicle details into a structured Excel template; a Python and Selenium runner handles bulk Guidewire configuration in the background, including automatic VIN lookups. Reduced repetitive re-entry, improved required-field consistency, and let underwriters keep working in a familiar Excel workflow without learning a new tool.

Note: This project is a component of the SGI Automation initiative.